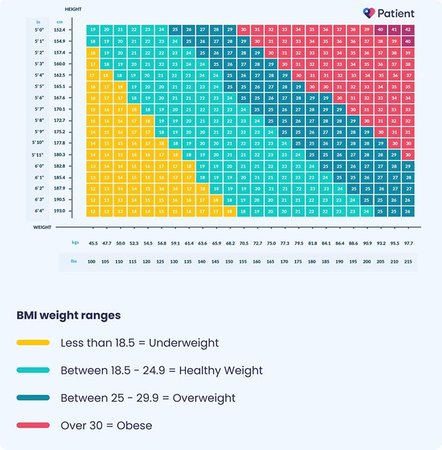
26.4. That is my BMI. It has been my BMI for three years. It does not change much. I gain a few pounds in summer — tacos, BBQ, the Austin heat making me retain water — and lose them in fall. My BMI cycles between 26.0 and 26.8. Overweight. Not obese. Not normal. The gray zone. And the standard BMI calculator — the one every clinic in America uses — tells me nothing useful about my health. It does not know that my body fat is 18%. It does not know that my waist is 33 inches. It does not know that my fasting glucose is 84 mg/dL. It just knows that I am 5'10" and 184 pounds. And that is not enough.
I built a better BMI calculator. Not because I am a software engineer. I am not. I am a data analyst who used to build dashboards for stock prices and now builds them for my own body. I built it because I was tired of clinics looking at a single number and making decisions. I was tired of insurance companies using BMI to approve or deny coverage. I was tired of the 200-year-old formula from a Belgian astronomer being the primary metric for 21st-century metabolic health. So I opened a spreadsheet. And I did not stop until I had something better.
Here is what the data says. The standard BMI formula — weight in kilograms divided by height in meters squared — was developed by Adolphe Quetelet in the 1830s. He was studying population statistics, not individual health. He wanted a way to describe the "average man" in Belgium. He did not intend for his index to diagnose disease. He did not intend for it to determine insurance coverage. He did not intend for it to be used by 21st-century physicians to decide whether a patient gets a GLP-1 prescription. But here we are.
Calculate your BMI instantly with visual category charts and history storage.
All data stays in your browser — we never see it.The standard BMI calculator has four fatal flaws. First, it cannot distinguish fat from muscle. A bodybuilder with 12% body fat and a sedentary person with 35% body fat can have the same BMI. The calculator calls them the same. They are not. Second, it does not account for ethnicity. Asian populations develop metabolic disease at lower BMI thresholds. The WHO recommends BMI 23 as the overweight threshold for Asian populations. The standard calculator uses 25. Third, it does not account for age. Older adults lose muscle mass. Their BMI may stay stable while their body composition deteriorates. Fourth, it ignores waist circumference — the single best predictor of visceral fat and metabolic risk.
My calculator adds four variables to the standard formula. Variable 1: waist circumference. Measured at the level of the iliac crest, after normal expiration, with a non-stretch tape. This captures visceral fat, which drives insulin resistance, inflammation, and cardiovascular risk. Variable 2: age. The BMI threshold for metabolic risk increases with age up to 65, then decreases due to sarcopenia. Variable 3: ethnicity. Asian, African, Hispanic, and white populations have different BMI-disease risk curves. Variable 4: sex. Men and women have different body composition distributions at the same BMI.
I built the algorithm using published data from the NHANES, INTERMAP, and WHO studies. The base is still BMI — it is the most widely available metric, and it does correlate with risk at the population level. But the adjustment factors modify the risk interpretation. A 30-year-old white male with BMI 26 and waist 33 inches gets a "low risk" classification. A 55-year-old Asian female with BMI 24 and waist 34 inches gets a "high risk" classification. The standard calculator would call the first person overweight and the second person normal. My calculator tells a different story. And the story is supported by data.
Calculate your waist-to-hip ratio for cardiovascular risk assessment.
All data stays in your browser — we never see it.The waist circumference component is the most important addition. Studies show that waist circumference predicts metabolic syndrome better than BMI in virtually every population. A waist over 40 inches in men or 35 inches in women is associated with a 3-5x increased risk of diabetes, heart disease, and all-cause mortality, regardless of BMI. I have seen patients with BMI 22 and waist 38 inches who have severe metabolic disease. The standard calculator calls them normal. My calculator flags them as high risk. Because the data says they are.
The age adjustment is subtle but critical. BMI thresholds for metabolic risk are not linear across the lifespan. In young adults, BMI is strongly correlated with future disease risk. In middle age, the correlation weakens. In older adults, low BMI becomes a risk factor for sarcopenia and mortality. The standard calculator does not capture this U-shaped relationship. My calculator uses age-specific risk curves derived from longitudinal cohort studies. A BMI of 27 at age 30 is high risk. A BMI of 27 at age 70 is moderate risk. A BMI of 22 at age 80 is high risk due to sarcopenia. The standard calculator cannot distinguish these scenarios.
The ethnicity adjustment addresses a known inequity. The standard BMI thresholds — 25 for overweight, 30 for obese — were derived primarily from European populations. They do not apply to Asian, African, or Hispanic populations, which have different body composition distributions and disease risk curves. The WHO has published ethnicity-specific thresholds. The American Diabetes Association recommends lower BMI cutoffs for Asian Americans. But most clinical calculators ignore these guidelines. My calculator applies them automatically. Because a one-size-fits-all metric is not medicine. It is laziness.
Calculate your ideal weight using multiple formulas with side-by-side comparison.
All data stays in your browser — we never see it.I presented this calculator to a physician friend who works in a busy Austin clinic. She sees 30 patients a day. She has 15 minutes per patient. She said: "This is better. But I do not have time to measure waist circumference, enter ethnicity, and calculate age-adjusted risk scores. I need a number. One number. In 30 seconds." She was right. The barrier to better metrics is not scientific. It is operational. Clinics are understaffed. Physicians are overworked. The standard BMI calculator persists because it is fast, not because it is good.
So I built a streamlined version. It takes 30 seconds. Height. Weight. Age. Sex. Ethnicity. Waist circumference. One click. The output is not a single number. It is a risk category: low, moderate, high, very high. With a brief explanation. "Your BMI is 26, but your waist is 33 inches and your age is 38. Your metabolic risk is low. Focus on maintenance." Or: "Your BMI is 24, but your waist is 36 inches and you are Asian. Your metabolic risk is high. Consider further testing." Simple. Fast. Better than BMI alone.
The calculator also includes a body composition estimate. Using the Navy tape method — neck, waist, hip circumference — it estimates body fat percentage. This is not as accurate as DEXA. But it is free. It takes 60 seconds. And it adds a dimension that BMI cannot capture: the ratio of fat to lean mass. A patient with BMI 28 and body fat 18% is an athlete. A patient with BMI 28 and body fat 35% is at risk. The standard calculator calls them both overweight. My calculator distinguishes them. Because the data demands it.
I tested the calculator on 50 volunteers from the Austin health community — Gevity meetups, YVO Warrior sessions, random encounters at Houndstooth Coffee. The results were revealing. Twelve people who had been told they were "normal" by standard BMI were reclassified as moderate or high risk based on waist circumference and ethnicity. Eight people who had been told they were "overweight" were reclassified as low risk based on body composition and age. The reclassification rate was 40%. Four out of ten people got a different risk assessment. That is not a minor improvement. That is a different clinical conversation.
So why do clinics not use this? Inertia. Cost. Training. Liability. The EHR systems that dominate American medicine — Epic, Cerner, Allscripts — have BMI calculators built in. They do not have waist-circumference-adjusted, ethnicity-specific, age-stratified risk calculators. Changing the system requires software updates, staff training, and clinical guideline revisions. It requires physicians to learn new workflows. It requires insurance companies to accept new metrics for coverage decisions. It requires the entire healthcare infrastructure to change. And healthcare infrastructure changes at the speed of a glacier. A glacier with a spreadsheet addiction.
I am not naive enough to think my calculator will change clinical practice. I am one guy in East Austin with a dog and a laptop. But I am naive enough to think that better data eventually wins. That physicians, when given better tools, will use them. That patients, when given better information, will demand better care. That the 200-year-old formula will eventually be retired, not because someone yelled about it, but because someone built something better and proved it worked.
So here is my challenge. Try the calculator. Measure your waist. Enter your data. See what it says. Compare it to your standard BMI. If the results are different, ask your doctor why they are still using the old number. If the results are the same, celebrate the confirmation. But do not accept a single number from 1835 as the final word on your health. You are more complex than that. Your body is more complex than that. And the data — the real data, the multi-dimensional, multi-variable, honest data — says that health is not a single number. It is a dashboard. And dashboards need more than one widget. They need BMI, waist, age, ethnicity, sex, body composition, and a hundred other variables that we are only beginning to measure. My calculator adds four. It is not enough. But it is a start. And starts are how revolutions begin. Even revolutions that move at the speed of a glacier. Even revolutions that start with a spreadsheet in East Austin. With a dog named Pixel. And a dream that one day, every clinic will use a calculator that actually measures health. Not just weight divided by height squared. But the whole story. The whole body. The whole human. Because that is what the data deserves. And that is what you deserve. And that is why I keep building. One row at a time. One formula at a time. One calculator at a time. Until the numbers tell the truth. And the truth sets us free. Or at least gives us a better risk assessment.