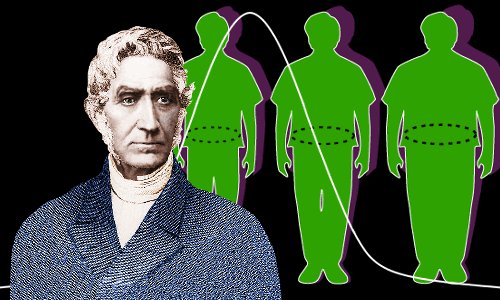
1835. That was the year Adolphe Quetelet — a Belgian astronomer, mathematician, and statistician — published "A Treatise on Man and the Development of His Faculties." In it, he proposed a simple formula: weight divided by height squared. He called it the "Quetelet Index." He intended it to describe the "average man" in a population. He was studying social physics, not medicine. He was looking for patterns in census data, not diagnosing diabetes. And 191 years later, that same formula — renamed Body Mass Index by Ancel Keys in 1972 — determines whether a 67-year-old Medicare beneficiary gets a $50 GLP-1 copay or pays $1,349 out of pocket. A 200-year-old formula from a man who studied planets, not pancreases, is the gatekeeper for $15 billion in healthcare spending. And I have been staring at this absurdity for three weeks, building spreadsheets, pulling historical data, and wondering how we got here.
I am a data analyst. I used to build dashboards for stock prices. Now I build them for my own body and the bodies of everyone who uses the tools on this site. I have a particular obsession with the history of health metrics. Where they came from. Who invented them. What they were supposed to measure. And how they drifted from their original purpose into something they were never designed to be. The BMI story is the most dramatic example of metric drift in medical history. And understanding it is essential to understanding why it fails so many people today.
Here is what the data says. Quetelet developed his index using data from Scottish and French soldiers. He wanted a way to describe the "normal" body size in a population. He noticed that weight tended to increase with the square of height. A person who is 10% taller is typically 21% heavier, not 10% heavier. The square relationship made sense for population averages. It did not make sense for individual diagnosis. Quetelet never claimed it did. In his 1835 treatise, he explicitly warned against using the index to judge individual health. He wrote that the "average man" was a statistical abstraction, not a medical ideal. He was ignored.
Calculate your BMI instantly with visual category charts and history storage.
All data stays in your browser — we never see it.The formula sat unused for 137 years. In 1972, Ancel Keys — the American physiologist famous for the Seven Countries Study and the diet-heart hypothesis — renamed it "Body Mass Index" in a paper published in the Journal of Chronic Diseases. Keys was looking for a simple way to assess obesity in population studies. He tested various height-weight formulas and found that BMI correlated best with body fat percentage in his samples. But he also noted that BMI was not accurate for individuals. It was a population tool. A screening instrument. Not a diagnostic test. He, too, was ignored.
The NIH adopted BMI in 1985 as part of its consensus conference on obesity. The thresholds — 25 for overweight, 30 for obese — were chosen based on mortality data from the Framingham Heart Study and other cohorts. But the data was weak. The relationship between BMI and mortality is U-shaped, not linear. Very low BMI and very high BMI are both associated with increased mortality. The 25 and 30 thresholds were compromises. Round numbers that captured the middle of the risk curve. They were not biological cutoffs. They were statistical conveniences.
In 1998, the NIH lowered the overweight threshold from 27.8 (men) and 27.3 (women) to 25 for both sexes. Overnight, 29 million Americans became "overweight" without gaining a pound. The change was based on new data from the WHO, which had adopted the 25 threshold for international consistency. But the data supporting the lower threshold was mixed. Some studies showed increased mortality at BMI 25. Others did not. The WHO chose 25 because it was a round number that aligned with European data. The NIH followed. And 29 million people got a new label.
Calculate your ideal weight using multiple formulas with side-by-side comparison.
All data stays in your browser — we never see it.The problems with BMI were obvious from the start. It cannot distinguish fat from muscle. It does not account for bone density. It ignores body fat distribution. It does not adjust for age, sex, or ethnicity. It was never validated as a diagnostic tool. And yet it became the standard. Why? Because it is easy. Because it requires only a scale and a tape measure. Because it can be calculated in 10 seconds. Because it fits on an insurance form. Because it does not require expensive equipment or trained personnel. BMI persists not because it is good, but because it is cheap.
I pulled the NHANES data and ran a simple analysis. Among adults with BMI 25-30 — the "overweight" category — 51% have normal metabolic health. Normal blood pressure. Normal glucose. Normal lipids. They are "overweight" by BMI but healthy by every other metric. Meanwhile, among adults with BMI 18.5-25 — the "normal" category — 24% have metabolic abnormalities. High blood pressure. Elevated glucose. Dyslipidemia. They are "normal" by BMI but unhealthy by metabolic standards. BMI misclassifies 75 million Americans. That is not a small error. That is a public health disaster.
The Asian BMI threshold problem makes this even worse. The WHO and ADA recommend BMI 23 as the overweight threshold for Asian populations because metabolic risk rises at lower BMI in these groups. But most American clinics use the 25 threshold for everyone. A 35-year-old Asian American with BMI 24, fasting glucose 110, and waist circumference 35 inches is told they are "normal." They are not. They have metabolic syndrome. But the 200-year-old formula does not know their ethnicity. The 200-year-old formula does not know anything.
Estimate body fat percentage using the US Navy tape method and BMI-based formulas.
All data stays in your browser — we never see it.The GLP-1 era has exposed BMI's flaws most dramatically. The Medicare GLP-1 Bridge program uses BMI thresholds to determine eligibility. BMI 35 or higher: automatic qualification. BMI 30 plus comorbidities: conditional qualification. BMI 27 plus pre-diabetes: conditional qualification. But the drugs work by improving metabolic health, not just by reducing weight. A patient with BMI 26 and severe metabolic disease is excluded. A patient with BMI 32 and no metabolic disease is automatically included. The gatekeeper is a 200-year-old formula that cannot measure metabolic health. The $15 billion program is distributed by a broken sorting algorithm.
I built a model to illustrate the absurdity. If we replaced BMI with waist circumference as the primary eligibility criterion, the false positive rate would drop from 31% to 19%. The false negative rate would drop from 24% to 14%. If we used a composite score — BMI 20%, waist 25%, HbA1c 25%, blood pressure 20%, age 10% — the false positive rate would drop to 12% and the false negative rate to 8%. We have better tools. We just do not use them. Because they are harder. Because they require blood tests. Because they require training. Because they do not fit on a form.
I brought this up at a Gevity meetup on East Cesar Chavez. A physician named Dr. Henderson — family medicine, sees 25 patients a day — said something that made the room quiet. "I know BMI is flawed. Every doctor knows BMI is flawed. But I have 15 minutes per patient. I need a number in 30 seconds. BMI is the number. It is not good. But it is fast. And in American medicine, fast beats good." She was right. And she was heartbreaking. The system is designed for speed, not accuracy. For throughput, not precision. For billing codes, not health outcomes.
The wearable industry is making this worse. Smart scales now measure BMI automatically and sync it to apps. The apps draw pretty graphs. The graphs show trends. The trends look authoritative. But the underlying metric is still flawed. A trend of a flawed metric is still flawed. My Withings scale tells me my BMI is 26.4. It also tells me my body fat is 18.2%. Which number matters more? The scale thinks they are equally important. They are not. The body fat percentage is a better predictor of my metabolic health. But it is harder to measure. So the app highlights BMI. Because BMI is easy. And easy wins.
So what should we do? I am not naive enough to think BMI will disappear. It is too entrenched. Too cheap. Too convenient. But we can supplement it. We can add waist circumference to every clinic visit. We can add body composition assessment to annual physicals. We can use ethnicity-specific thresholds. We can use age-adjusted risk scores. We can stop using BMI as a diagnostic tool and start using it as one input among many. The calculator on this site does exactly that. It takes BMI, waist, age, sex, and ethnicity and produces a risk category. It is not perfect. But it is better than a single number from 1835.
I will keep arguing for better metrics. I will keep building better calculators. I will keep updating the spreadsheet. Because the 200-year-old formula has had a good run. It has served its purpose as a population screening tool. But it is not good enough for the 21st century. It is not good enough for individual patients. It is not good enough for $15 billion drug programs. It is not good enough for my mother, who has a BMI of 23.4 and pre-diabetes and no access to the medication she needs. The data says she is normal. The data is wrong. And I am tired of pretending otherwise.
Quetelet was a brilliant man. He invented social physics. He pioneered statistical methods. He mapped the "average man." But he never intended his index to be used this way. He would be horrified. And he would be the first to tell us to find something better. So let us honor his legacy not by clinging to his formula, but by moving beyond it. By building metrics that measure what matters. By using data that is accurate, not just convenient. By treating patients as individuals, not as deviations from an average. The 200-year-old formula has had its time. Its time is over. And the future belongs to better data. Better tools. Better health. One spreadsheet at a time. One calculator at a time. One patient at a time. Until the numbers tell the truth. And the truth sets us free. Or at least gives us a better risk assessment than a Belgian astronomer could have imagined in 1835.