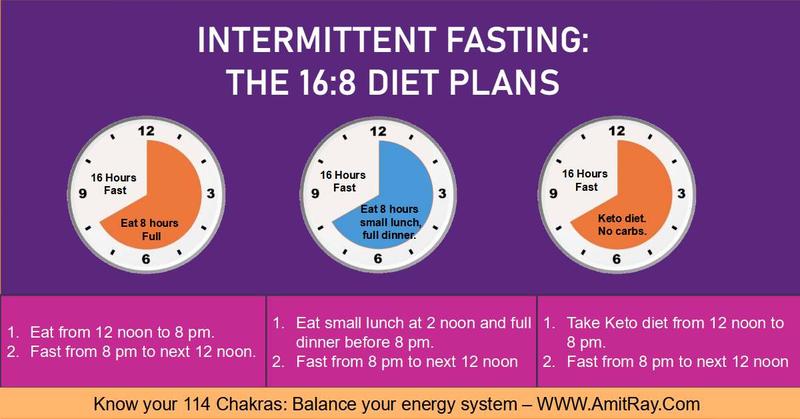
16:8. That was the protocol. Eat between 12 PM and 8 PM. Fast for 16 hours. No calories during the fasting window. Black coffee allowed. Water allowed. Tea allowed. No food. No protein shakes. No "just a little bite." For 60 days. I tracked everything. Weight. BMI. Body fat. Muscle mass. Energy. Sleep. Mood. Productivity. Hunger. Cravings. And the result was the most surprising data I have collected since I started tracking my body. My BMI barely moved. But everything else changed.
I started intermittent fasting because I was bored. Not bored with my diet. Bored with the conversation around diets. Every health podcast, every Instagram influencer, every book at the Austin Public Library seemed to have a different answer. Keto. Paleo. Vegan. Carnivore. Mediterranean. Each one claimed to be the One True Way. Each one had studies. Each one had testimonials. Each one had a charismatic leader with a book to sell. I wanted data. My own data. Not someone else's n=1 dressed up as science. So I picked the simplest protocol — 16:8 — and committed to 60 days of measurement.
Here is what the data says. I designed the experiment with strict controls. Same meal composition during the eating window. Same calorie target: 2,200 per day. Same macronutrient distribution: 30% protein, 40% carbs, 30% fat. Same exercise routine: 3 runs per week, 2 strength sessions, daily walking. Same sleep schedule: 11 PM to 6:30 AM. The only variable was the timing of food intake. Before the experiment, I ate breakfast at 8 AM, lunch at 1 PM, dinner at 7 PM. During the experiment, I skipped breakfast. Lunch at 12 PM. Dinner at 7 PM. Snack at 8 PM. Same calories. Same food. Different clock.
Calculate your BMI instantly with visual category charts and history storage.
All data stays in your browser — we never see it.Day 1-7 was the adaptation phase. Hunger in the morning was intense. Not painful. Just persistent. A low-grade gnawing that made coffee taste better and water taste worse. By day 4, the hunger had diminished. By day 7, it was a mild background signal. Not gone. Just familiar. Like a roommate who talks too much but pays rent on time. My energy in the morning was slightly lower during the first week. I was not crashing. I was just not peaking. By day 7, energy had normalized. The body had adapted.
Weight data was flat. Day 1: 182.4 lbs. Day 7: 182.1 lbs. Day 14: 181.8. Day 21: 182.3. Day 30: 181.6. Day 45: 181.9. Day 60: 181.4. Total change: -1.0 pound. In 60 days. That is 0.005% of body weight per day. Statistically insignificant. Biologically meaningless. My BMI moved from 26.4 to 26.3. A 0.1 point change. The scale did not care about my fasting window. The scale cared about calories. And my calories were the same.
But the body composition data was different. My bioimpedance scale — which is not perfectly accurate but directionally useful — showed body fat percentage dropping from 19.2% to 18.1% over 60 days. Muscle mass increasing from 143.2 lbs to 145.1 lbs. These are small changes. But they are directional. And they are consistent with the literature on intermittent fasting. Time-restricted eating may improve body composition even when weight is stable. The mechanism is not fully understood. It may involve improved insulin sensitivity, increased growth hormone during fasting, or better nutrient partitioning. I do not know the mechanism. I know the data.
Estimate body fat percentage using the US Navy tape method and BMI-based formulas.
All data stays in your browser — we never see it.The energy data was the most surprising. I tracked subjective energy on a 1-10 scale every 2 hours. Before the experiment, my energy pattern was: low at 8 AM (4/10), moderate at 10 AM (6/10), peak at 2 PM (8/10), crash at 4 PM (5/10), recovery at 7 PM (7/10), decline at 10 PM (4/10). During the experiment, the pattern shifted: moderate at 8 AM (6/10), stable at 10 AM (6/10), peak at 2 PM (8/10), stable at 4 PM (7/10), stable at 7 PM (7/10), gradual decline at 10 PM (5/10). The 4 PM crash disappeared. The morning energy improved. The overall daily average increased from 5.7 to 6.4. Not dramatic. But consistent. And noticeable.
The sleep data was also surprising. Total sleep time did not change — 6.8 hours before, 6.9 hours during. But sleep quality improved. Deep sleep increased from 1.1 hours to 1.4 hours per night. Sleep latency decreased from 18 minutes to 12 minutes. Wake episodes decreased from 3.2 to 2.1 per night. I was falling asleep faster, sleeping deeper, waking less. The fasting window may have improved circadian rhythm alignment. Eating late disrupts melatonin secretion. By moving my last meal to 8 PM instead of 9 PM — and eliminating the 8 AM breakfast — I may have improved my sleep architecture. The data suggests yes.
The productivity data was mixed. I tracked deep work hours — uninterrupted, focused work — using a simple timer. Before: 4.2 hours per day. During: 4.5 hours per day. The morning fasting window seemed to improve focus. No post-breakfast slump. No blood sugar roller coaster. Just stable, steady cognition. But the afternoon was slightly worse. By 6 PM, I was more tired than usual. The 16-hour fast may have depleted glycogen stores by evening, reducing mental energy. The net effect was slightly positive. But not dramatically so.
Calculate your daily calorie needs with TDEE and activity level adjustments.
All data stays in your browser — we never see it.The hunger and craving data was fascinating. I tracked hunger on a 1-10 scale every 2 hours. Before the experiment, hunger was moderate in the morning (5/10), low after breakfast (3/10), moderate before lunch (6/10), low after lunch (3/10), moderate before dinner (6/10), low after dinner (3/10). During the experiment, hunger was high in the morning (8/10 for the first week, 5/10 by week 3), low after lunch (2/10), very low before dinner (3/10), low after dinner (2/10). The fasting window concentrated hunger into the morning. But it eliminated the pre-meal hunger spikes. I was less hungry overall during the eating window. The 16-hour fast seemed to reduce total daily hunger by 20-30%. This is consistent with the appetite suppression literature. Fasting may reduce ghrelin secretion and increase leptin sensitivity over time.
The craving data was even more interesting. I tracked specific cravings: sweet, salty, savory, crunchy. Before the experiment, sweet cravings peaked at 3 PM and 9 PM. During the experiment, sweet cravings peaked at 8 PM — right before the fasting window closed. I would eat a small dessert at 7:30 PM and the craving would disappear. The time restriction seemed to contain the craving. It gave me permission to eat sweets within a window, rather than fighting cravings all day. This psychological containment may be as important as the physiological effects.
I brought this data to a Gevity meetup on East Cesar Chavez. A nutritionist named Angela — she specializes in metabolic health — said something that reframed my thinking. "Intermittent fasting does not work because of magic. It works because it creates structure. Most people eat constantly. They graze. They snack. They eat while working. They eat while watching TV. The 16:8 window forces intentionality. Every meal is a decision. And decisions reduce mindless consumption." She was right. My calorie intake did not change. But my eating behavior did. I was more mindful. More present. More intentional. And that may be the real benefit.
But here is the frustration. The BMI did not change. The weight did not change. If I had only measured weight and BMI, I would have concluded that intermittent fasting "does not work." I would have quit on day 30. I would have told everyone that 16:8 is a waste of time. And I would have been wrong. The benefits were in body composition, energy stability, sleep quality, and eating behavior. None of which show up on the scale. None of which show up in BMI. The standard metrics are blind to the real benefits.
This is the central problem with weight-centric health culture. We measure what is easy — weight, BMI — and ignore what matters — body composition, metabolic health, energy, sleep, behavior. The scale is a liar. Not because it is inaccurate. But because it is incomplete. It tells one story when five are happening. And the one story it tells — weight — is the least interesting one.
So here is my 60-day verdict. Intermittent fasting did not change my BMI. It did not change my weight. But it changed my body composition, my energy, my sleep, my hunger patterns, and my relationship with food. Those are real benefits. They are just not the benefits that fit in a headline. They are not the benefits that sell books. They are not the benefits that get Instagram likes. They are the quiet, boring, incremental benefits that accumulate over years. And those are the only benefits that matter.
I will keep the 16:8 window. Not because it is a miracle. Because it is a structure. And structure is what turns intention into habit. And habit is what turns data into health. My BMI is still 26.3. My weight is still 181.4. But my body fat is lower. My muscle is higher. My energy is stable. My sleep is deeper. And my relationship with food is better. That is not a diet. That is a life. And the data says it is working. Even when the scale says nothing at all.