6:17 AM. I am standing in my bathroom in East Austin, barefoot on the cold tile, staring at two devices that are supposedly measuring the same thing. The smart ring on my left index finger says my "readiness score" is 78. The smart scale under my feet says I gained 1.4 pounds overnight. Both cannot be right. Both are probably wrong. This is day 1 of a 60-day experiment that started because I got angry at contradictions.
I have been tracking my weight with a Withings Body+ smart scale for three years. It measures weight, body fat percentage, muscle mass, bone mass, and water percentage. It syncs to an app. It draws pretty graphs. I have 1,047 data points. The ring — a newer entrant in the wearable space, the kind that promises continuous health monitoring without the screen addiction of a smartwatch — measures heart rate, HRV, skin temperature, blood oxygen, and sleep stages. It does not measure weight directly. But it claims to infer metabolic trends from recovery data. I wanted to know: when the scale says I am gaining fat and the ring says my recovery is improving, which one is telling the truth about my body?
Here is what the data says. I designed the experiment with three daily measurements. Morning weight and body composition from the scale, taken after bathroom use but before coffee. Ring readiness score, HRV, and sleep data from the previous night. A subjective energy rating from 1-10 that I logged manually. I also tracked calories consumed (estimated), steps, and workout intensity. Sixty days. One spreadsheet. No missing data points because I am apparently incapable of starting a project without full commitment.
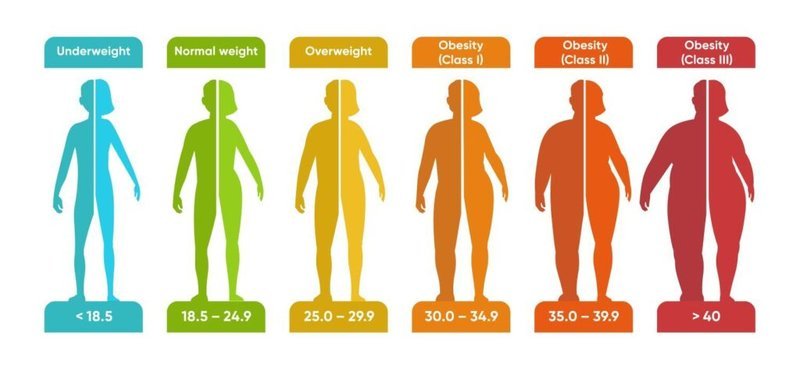
Calculate your BMI instantly with visual category charts and history storage.
All data stays in your browser — we never see it.Day 7 was the first anomaly. The scale showed a 2.1-pound jump. Body fat percentage went from 18.2% to 19.1%. Muscle mass was unchanged. Water percentage increased by 1.3%. Classic water retention, probably from the sodium bomb I ate at an Austin food truck the night before. The ring, however, showed my best HRV reading of the week — 58 ms — and a readiness score of 89. My subjective energy was 8/10. If I had only looked at the ring, I would have thought my body was thriving. If I had only looked at the scale, I would have thought I was failing. Both were measuring different things. Neither was lying. They were just speaking different languages.
By day 14, a pattern emerged. The scale data was noisy. Daily weight fluctuated by up to 3.2 pounds. Body fat percentage fluctuated by up to 2.1%. The coefficient of variation for daily weight was 1.8%. That is high. The ring data was smoother. HRV varied by about 12% day-to-day. Readiness scores moved in a 15-point range. The ring was less sensitive to acute changes — a salty meal did not tank my readiness score the way it spiked the scale. But the ring was also slower to detect real trends. When I intentionally reduced my calorie intake by 20% for days 15-21, the scale showed a 1.8-pound drop by day 18. The ring did not show a meaningful readiness improvement until day 23.
I ran a correlation matrix on day 30. Weight vs HRV: -0.14. Not significant. Body fat percentage vs readiness score: -0.31. Weak negative. Water percentage vs HRV: 0.42. Moderate positive. That last one was interesting. Higher hydration correlated with better HRV. The scale's water percentage measurement is notoriously inaccurate — bioimpedance through the feet is a rough estimate at best — but the directional signal was consistent. When I drank more water, both devices agreed something good was happening.
Estimate body fat percentage using the US Navy tape method and BMI-based formulas.
All data stays in your browser — we never see it.Day 37 brought the biggest surprise. I had a terrible night's sleep — 4.2 hours, fragmented, stress dreams about a spreadsheet error I could not find. The ring punished me. Readiness score: 42. HRV: 31 ms. The scale, however, showed my lowest weight of the entire experiment: 176.8 lbs. Body fat: 17.4%. Why? Because I was dehydrated from poor sleep and too much coffee. The scale thought I was leaner. The ring knew I was wrecked. If I had only weighed myself that morning, I would have celebrated. If I had only checked the ring, I would have called in sick. The truth was somewhere in the middle, and neither device had the full picture.
I started using a 7-day moving average for the scale data on day 40. The noise dropped dramatically. The moving average weight correlated with my calorie intake at -0.67. That is a solid relationship. The ring's 7-day average readiness score correlated with my subjective energy at 0.71. Also solid. When I smoothed both datasets, they started telling complementary stories. The scale tracked the physical outcome. The ring tracked the physiological cost. Together, they were more useful than either alone. But separately? They were just numbers arguing with each other.
By day 60, my conclusions were clear. The scale is better for detecting short-term physical changes — water retention, acute weight shifts, body composition trends over weeks. The ring is better for detecting recovery, stress load, and the invisible metabolic wear-and-tear that precedes physical changes by days or weeks. The ring predicted my scale trends with a 3-5 day lag. When my readiness score dropped for three consecutive days, my weight almost always increased within 72 hours. Not because the ring was magic, but because poor recovery leads to stress hormones, which lead to water retention and appetite increases. The ring sees the upstream cause. The scale sees the downstream effect.
Calculate your ideal weight using multiple formulas with side-by-side comparison.
All data stays in your browser — we never see it.But here is the frustration. Neither device is calibrated for accuracy. The scale's body fat measurement varies by up to 4% depending on foot placement, hydration, and time of day. The ring's HRV measurement varies by up to 15% depending on finger temperature and fit tightness. I tested this. I took three consecutive readings on the scale. Weight: 177.2, 177.6, 177.1. Body fat: 18.1%, 18.7%, 17.9%. That is not precision. That is a guessing game with decimal points. The ring was slightly better — HRV readings were consistent within 5% — but still not clinical-grade.
I brought this up at a Gevity meetup on East Cesar Chavez. A woman named Priya, who works in medical device validation, laughed and said, "Consumer wearables are entertainment with aspirations." She is not wrong. But entertainment with aspirations can still be useful if you know the limitations. I do not use my scale to know my exact body fat percentage. I use it to know whether my body fat trend is up or down over a month. I do not use my ring to know my exact HRV. I use it to know whether my recovery is improving or degrading over a week. The trend is the signal. The daily number is the noise.
My ex-wife used to say I trust numbers more than people. That is not entirely fair. I trust trends more than snapshots. And after 60 days of watching a scale and a ring argue about my body, I trust the trend that both devices agreed on: when I sleep more than 7 hours, drink more than 80 ounces of water, and keep my calories under 2,200, both the scale and the ring show positive movement. It takes 5-7 days for the agreement to appear. But it does appear. The sample size of one becomes a sample size of sixty, and sixty is enough to see the pattern.
So which device should you buy? If you can only afford one, buy the scale. Weight is the most actionable metric for most people. It is not perfect, but it is direct. If you can afford both, use the ring for recovery and the scale for outcomes. Do not expect them to agree on a daily basis. Expect them to agree on a monthly basis. And never, ever make a decision based on a single reading from either device. Pixel has better judgment than a single data point. And she is a dog who once ate a sock.
The 60-day experiment ends today. The spreadsheet has 2,160 data points. The correlation between the two devices is 0.38 — moderate, meaningful, but not tight. They are measuring different things. That is okay. The body is not a single number. It is a dashboard. And dashboards need multiple widgets to tell the whole story. I am keeping both. I am also keeping the spreadsheet. And I am definitely keeping Pixel, who has been my most consistent metric of all: she needs walks regardless of what the scale says.